Video Structural Similarity Index (SSIM) Analysis
Hybrik has a variety of video analysis types to algorithmically approximate a video’s subjective quality. SSIM analysis looks at structural information in the video source compared to the “compare” asset. Videos are compared frame by frame for spatial correlation between pixels and reports back how different each frame is.
The score ranges from 0 to 1, where 0.95 or higher is considered “very close”.
Sample Usage
Because SSIM compares the difference between two videos, you must specify a compare_asset to be used.
The sample JSON below is set to analyze the SSIM difference between the video fed into the analyze task and the compare_asset, in this case the source video.
{
    "uid": "ssim_analyze_task",
    "kind": "analyze",
    "task": {
        "retry_method": "fail"
    },
    "payload": {
        "general_properties": {
            "enabled": true
        },
        "compare_asset": {
            "kind": "asset_url",
            "payload": {
                "storage_provider": "s3",
                "url": "{{source_path}}/{{source_filename}}"
            }
        },
        "deep_properties": {
            "video": {
                "ssim": {
                    "enabled": true
                }
            }
        }
    }
}
Analyzer Results
In the results, you get information such as frame count, SSIM mean, standard deviation and the location in the media of the highest and lowest SSIM scores.
Results from running this analysis will be reported in the Hybrik console, as well as in the job summary json, in the “analyzer / deep_properties” section of the job result json.
In the Hybrik console:
- Select the completed job from the list in the upper pane
- In the lower pane click the “Task Details” tab
- Click the “Analyzer Results” box
- Expand the view
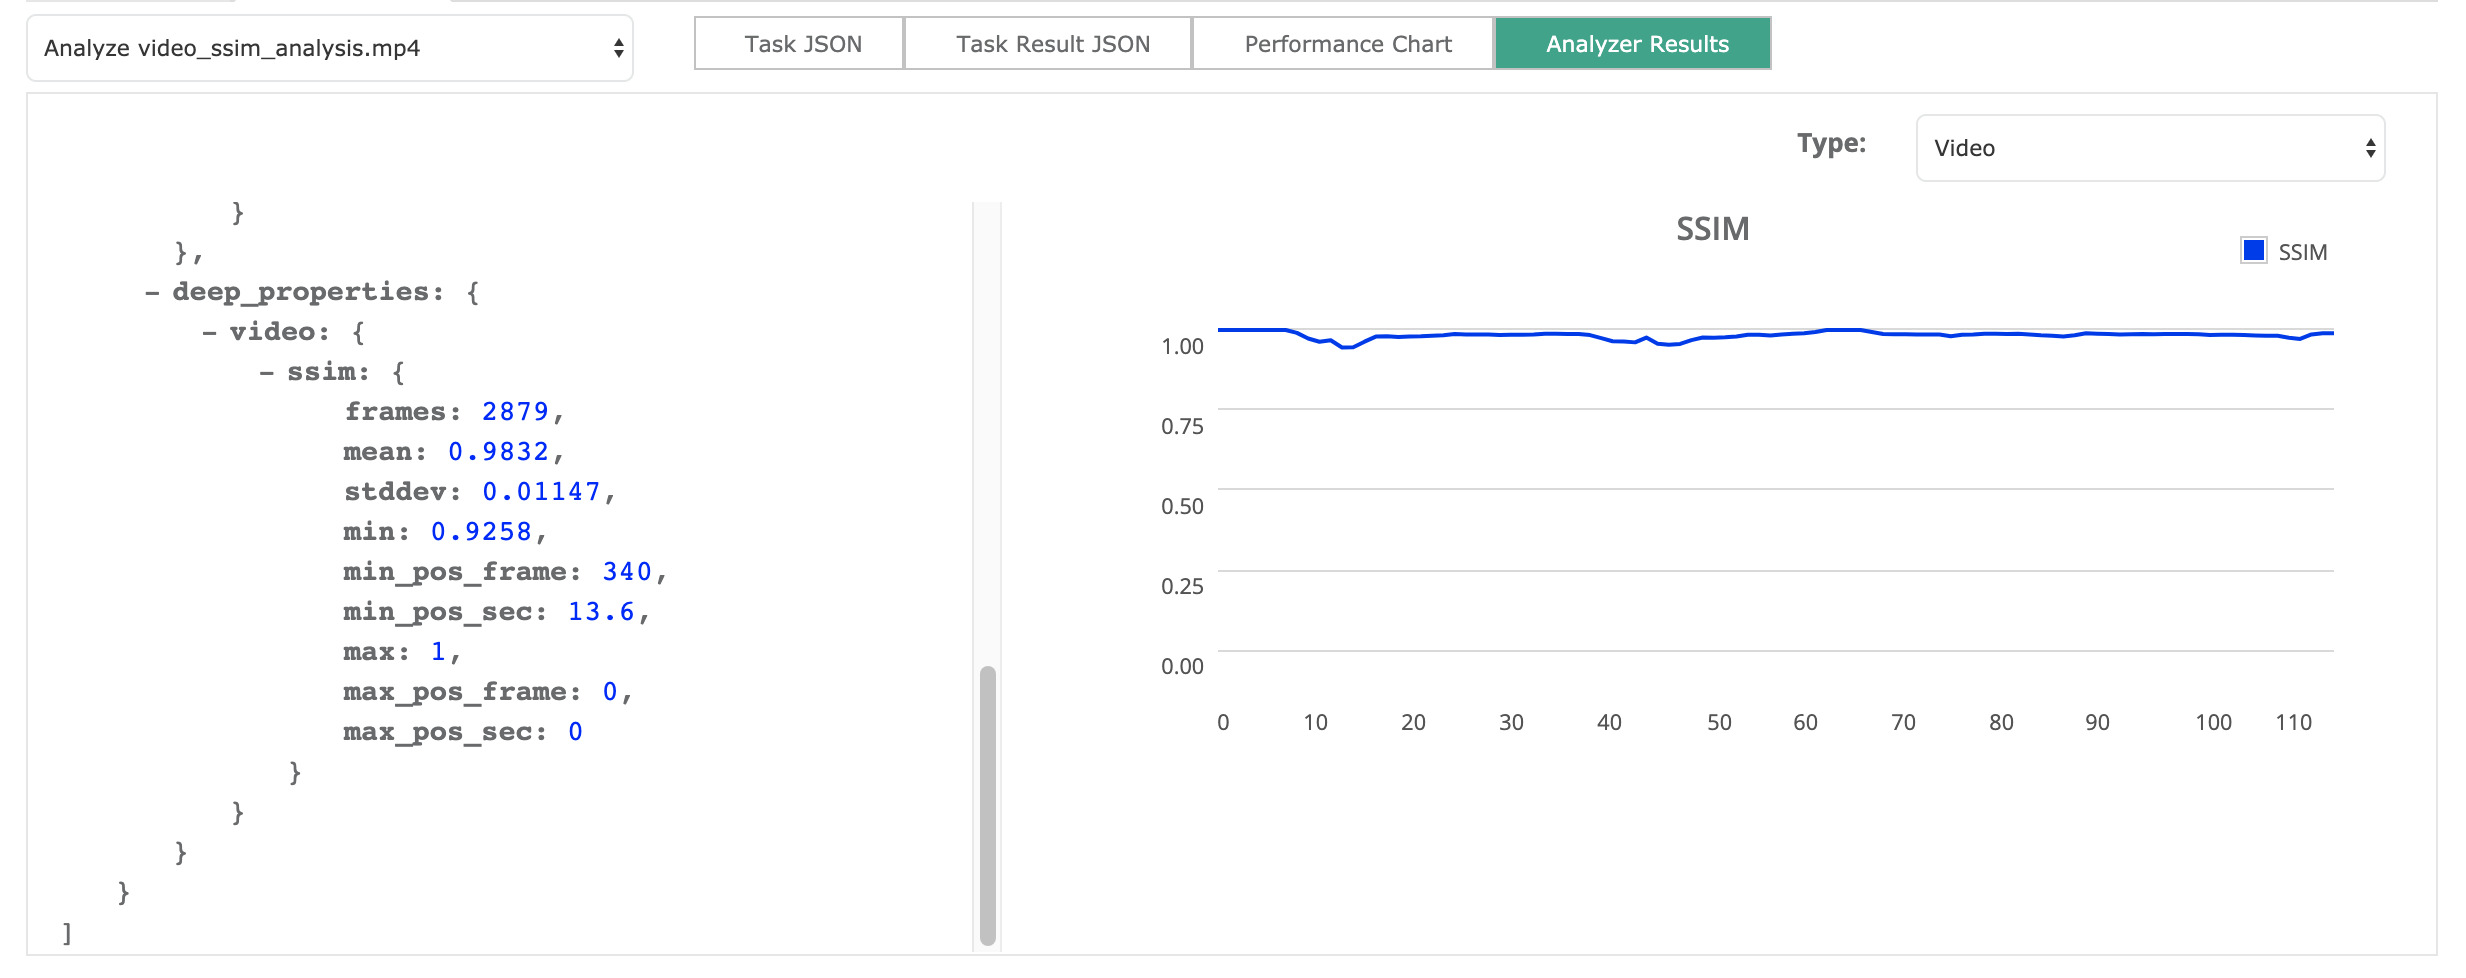
Analysis Result JSON Excerpt
"deep_properties": {
  "video": {
    "ssim": {
      "frames": 2879,
      "mean": 0.9832,
      "stddev": 0.01147,
      "min": 0.9258,
      "min_pos_frame": 340,
      "min_pos_sec": 13.6,
      "max": 1,
      "max_pos_frame": 0,
      "max_pos_sec": 0,
      "charts": [
        ...