Video Peak Signal to Noise Ratio (PSNR) Analysis
Hybrik has a variety of video analysis types to algorithmically approximate a video’s subjective quality in comparison to a compare_asset. A common pattern is to connect a transcode task to an analyze task, using the original source file as the compare_asset to compare the quality of your transcoded output to the original source.
PSNR approximates quality of the video by looking at the signal difference of the compare_asset to the source and looking at the noise, or errors, introduced in compression.
The score ranges depending on bit-depth. For 8-bit video, a typical range for scores is 25-50dB with higher values being a better result. 45dB or higher is considered to be excellent.
Sample Usage
Because PSNR compares the difference between two videos, we pass a compare_asset to be used.
The sample json below is set to analyze the SSIM difference between the video fed into the analyze task (from the upstream task, such as a source or transcode task) and the compare_asset, in this case the source video.
{
    "uid": "psnr_analyze_task",
    "kind": "analyze",
    "task": {
        "retry_method": "fail"
    },
    "payload": {
        "general_properties": {
            "enabled": true
        },
        "compare_asset": {
            "kind": "asset_url",
            "payload": {
                "storage_provider": "s3",
                "url": "{{source_path}}/{{source_filename}}"
            }
        },
        "deep_properties": {
            "video": {
                "psnr": {
                    "enabled": true
                }
            }
        }
    }
}
Analyzer Results
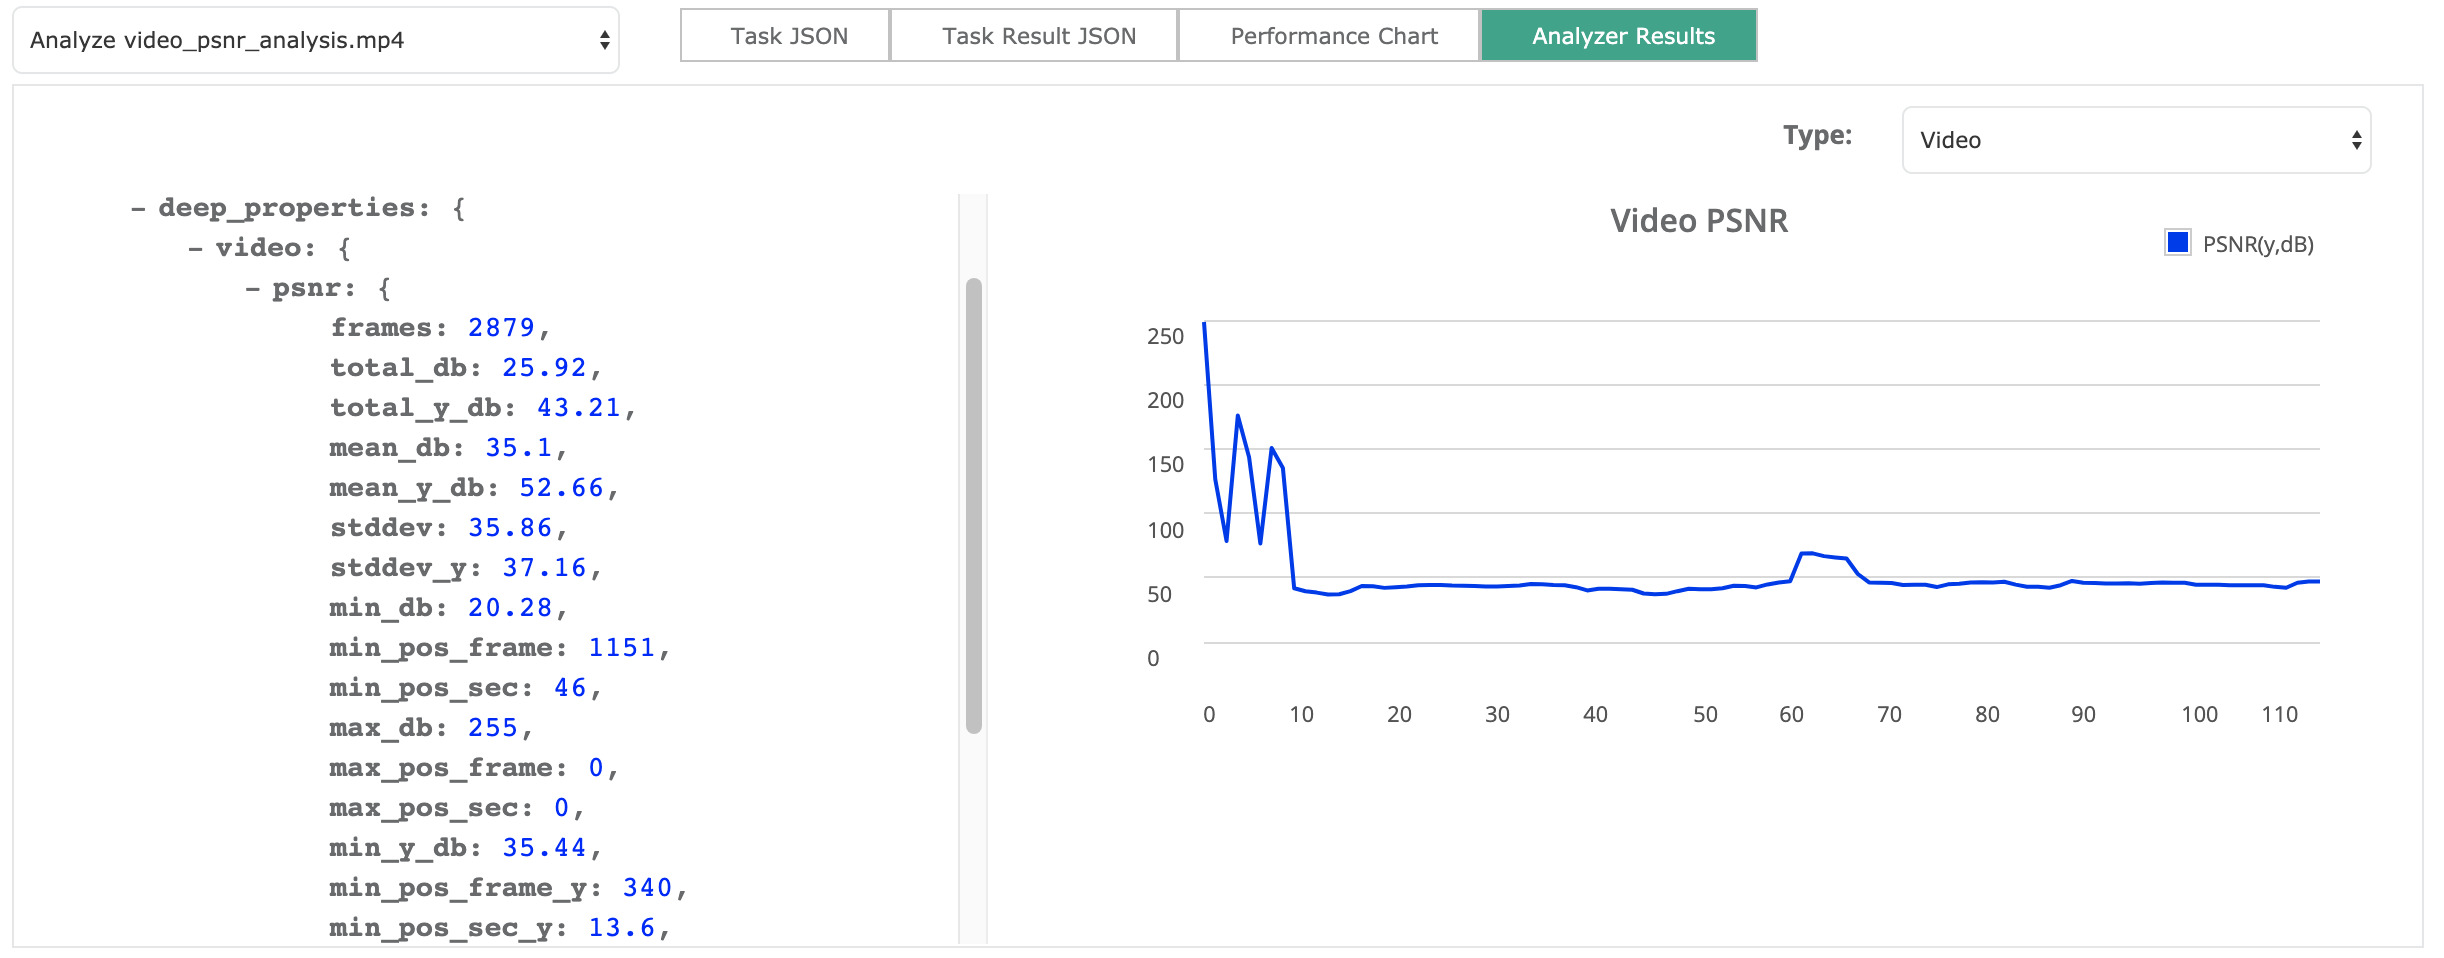
In the results you get information such as frame count, PSNR mean, standard deviation and the location in the media of the highest and lowest scores.
Results from running this analysis will be reported in the Hybrik console, as well as in the job summary json, in the “analyzer / deep_properties” section of the job result json.
In the Hybrik console:
- Select the completed job from the list in the upper pane
- In the lower pane click the “Task Details” tab
- Click the “Analyzer Results” box
- Expand the view
Job Summary JSON Excerpt
"deep_properties": {
  "video": {
    "psnr": {
      "frames": 2879,
      "total_db": 25.92,
      "total_y_db": 43.21,
      "mean_db": 35.1,
      "mean_y_db": 52.66,
      "stddev": 35.86,
      "stddev_y": 37.16,
      "min_db": 20.28,
      "min_pos_frame": 1151,
      "min_pos_sec": 46,
      "max_db": 255,
      "max_pos_frame": 0,
      "max_pos_sec": 0,
      "min_y_db": 35.44,
      "min_pos_frame_y": 340,
      "min_pos_sec_y": 13.6,
      "max_y_db": 255,
      "max_pos_frame_y": 0,
      "max_pos_sec_y": 0,
      "charts": [
        ...